Excel At Tableau Tables
Get ongoing access to the recordings of this live event PLUS the Tableau workbooks we used during the 5 day live challenge.

Is This course For Me?
This will especially be for you if...

You've tried to get Tableau Tables to do what you can easily do in Excel, but failed
You're sick of people telling you not to use tables in Tableau when your users demand it
Or you are new to Tableau and you just need to replicate what Excel currently gives you as soon as possible
You are an expert in Excel and don't want to be left behind...
SESSION 1
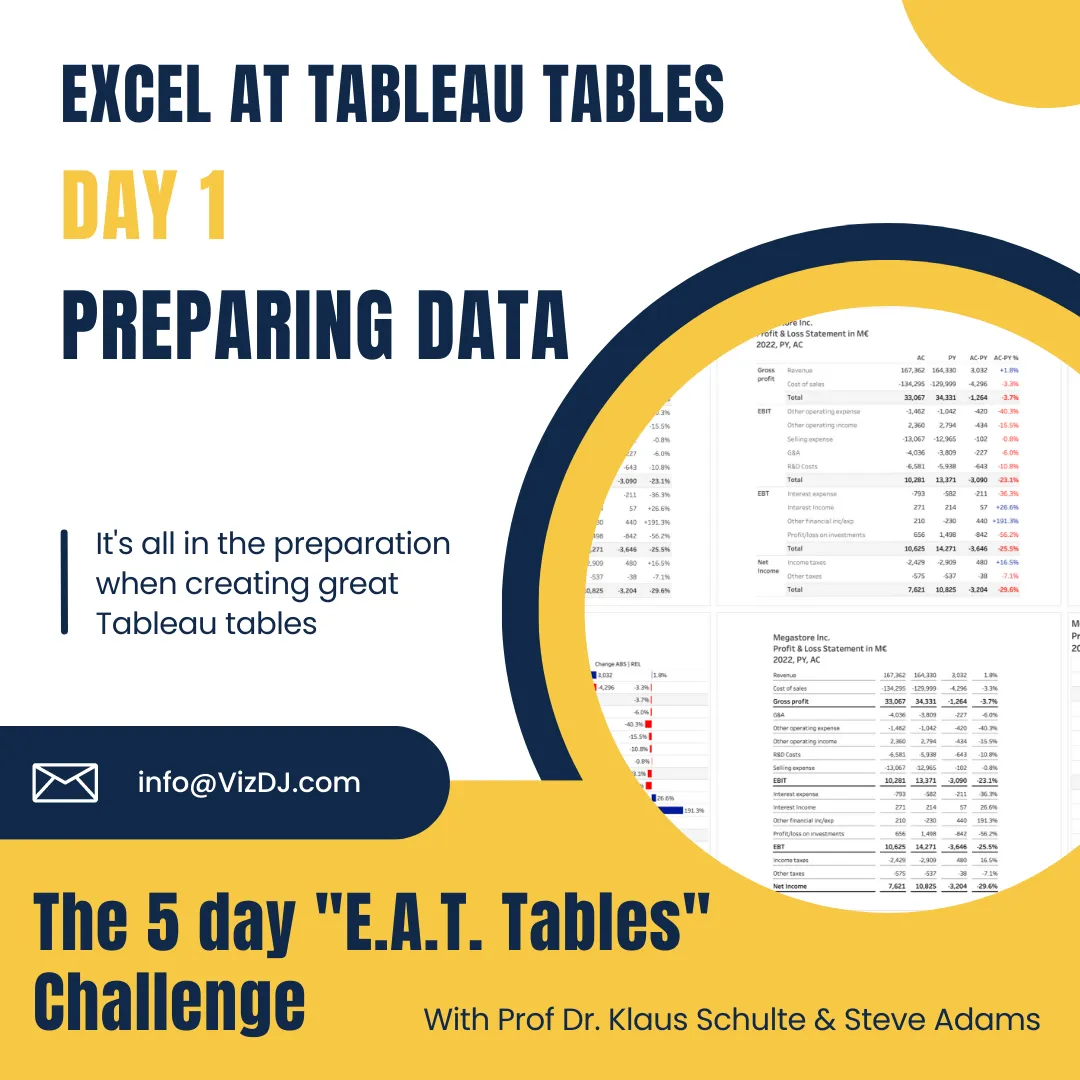
Preparing Data
It shouldn't be this hard to produce well formatted and insightful tables in Tableau. On day One we will:
Show you what can be achieved in real-world examples using the techniques you will learn during the challenge.
Cover why it's beneficial for both the report creators and the report users for your tables and analysis to both be in Tableau.
Set you on your way to preparing and structuring your data in readiness for the rest of the challenge.
NB: Set aside some time for homework on each day to get the most out of this process. We want you working on your own data!

SESSION 2
Building Tables
During day Two we look at overcoming the typical frustrations that Excel users face when wanting to build basic tables:
Creating sub-totals that work the way you need them to.
Add relative margin calculations with ease - e.g. % of Revenue.
Get formatting easily like you can in Excel with some Tableau formatting tips.
On day Two we will put your data to use in the homework!

SESSION 3
Creating Insights
On day Three we add easy insights to our tables in a number of different ways:
Adding icon indicators to show positive and negative indicators.
Colour encoding only selected columns in a multi-column table.
A quick waterfall chart that shows part-to-whole and respects sub totals along the way.
A relative variance pin chart - like those advocated in the International Business Communication Standards (IBCS).
SESSION 4
Integrating Charts
Day Four brings everything we have already created together as well as fixing some of those niggling details:
Introducing the technique of data densification.
Customising the labels on our sub-totals to be driven by our data.
Combining our charts into our table to improve user comprehension and insights.

SESSION 5
Levelling Up
Day Five introduces some advanced techniques that are easily repeatable:
Using map layers to get that "pixel perfect" look for column widths and row dividing lines.
Using advanced table techniques to get funky and combine wide charts within a table
Using your newly created tables as templates for future work to speed up the time to deliver value.